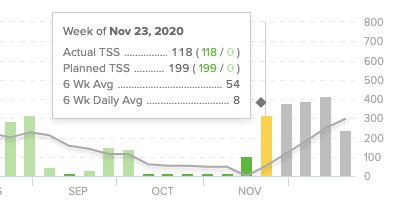
Winter is coming. I want to go skiing. Skiing requires a long drive. So, I usually plan a trip where I ski several days in a row and stay overnight to justify the long drive. I want to go skiing so bad! Snow is already perfect in the Methow. My heart wants to go now, but my body isn’t ready. For the few weeks that my gym was open I enjoyed several great workouts, but I never acclimated enough to be able to go 2 days in a row. Wne I go skiing I need to be ready to comfortably exert myself several days in a row. Time to start a training plan! The gym is closed again, so I started a base plan on TrainerRoad. I started with a ramp test and saw a small decrease in FTP. Even with that, each workout has proved far too difficult and technical for my current skill level. I can’t let that get me down. Obviously, it is perfectly logical for me to see a decline in fitness after 2 months of minimal activity. If I stay positive and stick with it, I’m sure to see rapid gains. Right now, my only goal is to follow the program, even if that means I have to drop the workout intensity by 15 or even 50%. It will come back if I stay diligent.
TrainerRoad TSS calendar
I reached an all-time fitness peak starting the spring of 2018 that lasted all the way through the end of the year. For the sake of comparison, I’ll compare some fitness indicators from them with now:
My VO2 max is 42 from 48.
My resting heart rate is 60 bpm from 54 bpm.
My FTP is 191 from 194.
My muscle mass is 100 lbs. from 112 lbs.
My weekly training load average is 300 from 1300.
My monthly Garmin intensity minutes is 1000 from 4000.
Boxing workout tolerance is 1 day with a day off from 4 days in a row before needing a day off.
In comparing my activity level from my last ski trip, I can see where I need to be to have a good ski trip again. I don’t want to overreach and lose time. I can’t perform at the training load TrainerRoad wants me to for the first week of training. I wore myself out more than 80 TSS pointes below where it set me. My hope is to ramp my TSS/load/intensity minutes to the upper end of the safe range for each week such that I build enough tolerance to ski several days in a row and still enjoy each day.
I set up my White Bike on the trainer in the spare room. I am downwind from the cat’s litter box, but it’s better than I imagined. It’s actually perfect. I get a lot of cold air and space to my self so I can sweat, huff and puff unencumbered. I started TrainerRoad’s Sweet Spot Base mid volume 1 training plan a week ago. I plan to finish the training plan by Christmas and be at the planned TSS level. After that, I should only take me another month to get to the point where I can ski a few days in a row comfortably.
Garmin annual report for VO2 max and training load


