
Garmin calculates a running tally of workout “load” based on the time and intensity of my workouts. While many metrics like “stress” and “body battery” feel too gimmicky for my taste, this load seems to have real wisdom. I noticed that it’s when I exceed the optimal load that I burn out and require so many rest days that I feel like I’m starting all over again. If Garmin doesn’t say I’m overdoing it, I tend to be able to stay on track. This is insightful for me during phases like the one I am in now where I’m working out less than typical, expect and remember the typical, but need to keep it slow to get back there. It was just a month ago that my optimal load was something like 300 a week, which is really hard to maintain considering I could exceed it by doing just 2 workouts. I took care, followed the data, and stayed on course. In a short amount of time, the high end of my load is up to 928. This is a number I can stay under and make steady, ongoing improvements with. Yay!
Workouts with Garmin

I made my very own workout routine using a medicine ball and then loaded it into Garmin connect. I press start of my watch and it tells me what to do when and counts the reps. Counting the reps is only as good as the hand wearing my watch moves, but all in all it’s a pretty good way to exersize.
I don’t do this workout as often as I’d like. But I did it today, and I’m feeling proud. Every moment matters.
I’m 20 years old

The Garmin Fenix series watches make a calculated estimate of VO2 max based on recorded physiological data over time. People tell me it’s pretty accurate. I remain skeptical, but only because it thinks I’m better than I think I am. Still, a VO2max of 48, or even anywhere in the 40s for that matter is as about as good as a non-competitive woman in her 40’s can get. I’m going to bask in the feeling of achievement this analysis that Garmin gave me.
Personalized Heart Rate Zones Matter
Garmin’s Default Zones

Personalized Zones
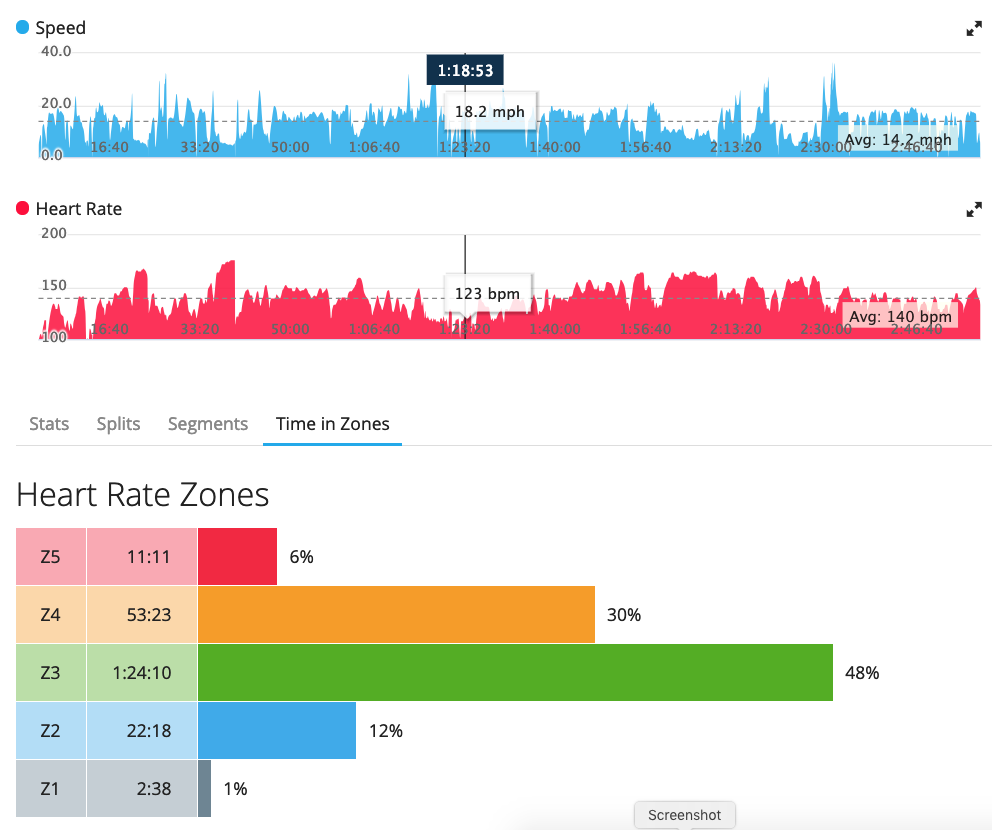
I recently had a performance test (VO2 Max and maximal heart rate). The physiologists assigned personalized heart rate zones using the results of this test. I decided to compare my new zones with my “old” zones. My old zones were assigned by Garmin Connect. Garmin uses a lot of information to create your zones, but can only estimate VO2 Max based on other data. The charts above represent 2 bikes rides. Both rides were with the same riding group, in similar areas north of Seattle. Both rides were very similar in distance, elevation, time and effort. Really only things different are the times spent in each heart rate zone. Even the average heart rates are practically identical! Garmin has me spending a little time in zone 2 and 5 and nearly the whole ride in zones 3 and 4. My personalized zones have me spending most of my time in zone 2. I also spent 30 minutes in zone 1 and no time in zones 4 and 5.
What does this mean and why do I care? Zone training is a bit of a dying art in cycling these days, falling behind power training. I am a recreational rider, I don’t compete, I have nothing to gain from training beyond good cardiovascular fitness, so I see no reason for me to shell out hundreds of dollars for a power meter. Even so, I am motivated to perform at my best, so gazing at my heart rate from time to time makes sense to me. The first thing I was told when I got my zones was that the most useful thing for me to do was to avoid zone 3 (the green zone) better known as “no man’s land”. While this aerobic level is a great place to build strong endurance, apparently you build it faster by spending more time in zone 2, then pushing up to zones 4 and 5. My head sunk when I heard this “green zone” training is the most common mistake made by casual cyclists, as I knew I spent the overwhelming majority of my time in the green zone. It also seemed curious to me how much time I spent in the upper zones. I’d spend some rides almost entirely in the top 2 zones. That didn’t seem healthy. However, by adjusting zones for my real calculated VO2 max, you see that I actually spend most of my time in zone 2, like I should. However, I spent a bit of time in zone 1, which is no zone at all. Zone 1 in this case is sitting heart rate. My lab used a 4-zone method and Garmin uses 5, so my personalized zone 1 is nothing and zone 2 has a wide range encompassing both warm-up and low intensity activity. Since my tracker times out when I am stopped, I spent too much time riding my bike not working out at all. I also spent a bit of time in zone 3, but I think that’s OK for this type of ride. It was a group ride, and our goal was to ride at the same pace, so nothing really called for the higher zone use.
I think it’s pretty interesting how different the graphs look. The “accurate” graph far better reflects my perceived exertion, for what it’s worth.
Heart Rate Zone Training Chart
I found this chart from a web search. I don’t like the “lose weight” category. From what I understand, the assumption of using zones to lose weight has been disproven. Even though it is easier and more sustainable for most people to do activity at low intensities (like walking), burning 100 calories walking or doing box jumps is the same 100 calories to your body’s caloric needs at the end of the day. That being said, I liked this chart the best out of the many out there.
Fun With Heart Rate Data

Garmin Heart Rate Data over time: Day with symptoms

Garmin Heart Rate Data over time: typical work out
I have a tendency to faint (not a big deal, I’ve been cleared medically). I’m not sure what causes it in every instance, but heat is my kryptonite. It was HOT and HUMID at the gym the other day. Just as I was getting to the most intense, portion of my work out, I started to feel faint. I didn’t lose my vision, but I did start to get that “feeling” that passing out was imminent if I didn’t stop. I was aware enough to take a glance at the heart rate reading on my Garmin watch, but not aware enough to realize what the sub-100 beats per minute meant. I stared, confused, and tried to adjust my chest strap. When the numbers didn’t budge, I took my pulse manually- and lo and behold, consistent with overexertion symptoms, my heart really was beating slowly! I instantly couldn’t wait to see the graph my monitor puts out.
The above graph is a segment of my overall workout on that hot and humid. My average heart rate (122 bpm) is the dotted line. As you can see, I’m cruising along at about 150, and right after my peak effort, you see a sudden drop. That’s where I got dizzy, just after the 50 minute mark. I posted a typical workout below. My heart rate goes up and down, but you don’t really see it go below my average until the cool down at 58 minutes. Unfortunately, it didn’t graph out as dramatic as I hoped. I dropped 75 bpm in 2 minutes and 48 seconds, which is on par with my recovery heart rate of about 65 bpm in 2 minutes. You can’t tell that I was near losing consciousness from the graph, I could have simply stopped working and the graph would have looked the same.
Bike Thing Thursday: The Garmin Vivoactive HR

Garmin Vivoactive HR scores 3 bikes out of 5.
My beloved Pebble watch started to die shortly before the company was destroyed by one of its greedy investors. I had planned to replace it with a new Pebble, seeing as this watch/piece of wearable tech was one of my all-time favorite devices. I couldn't believe the company ended just like that. It was the business story of horrors. Here I was, with an amazing device I loved, that became increasingly unusable every day. The screen started to pixelate and garble. Apparently this was the one flaws of pebbles, something that eventually happened to all of them. I felt pretty lucky, since mine lasted years longer than my boyfriend's. Still. Time to get a new device.
I spent hours upon hours reading reviews online, comparing features, and looking as devices in stores. I settled on a Garmin Vivoactive HR, in hopes to offset the expense of the device by having it serve as a watch and bike computer in one. From everything I read, the device's one flaw was inaccuracies with it's sleep tracking, which wasn't a concern for me. Sleep tracking was the one thing I didn't care to venture into.
I started writing a review for this watch when it was still new. I'm glad I waited over a year to finally publish it, as my feelings for it have warmed with time. It seems to work a little bit better with every update. I've had a lot of issues with this watch. I'll start by pointing out that I generated 17 threads thus far on the Garmin forum, trying to understand inconsistencies with this watch that haven't been addressed on the web. For instance, buttons on different windows respond differently. The two physical buttons on the bottom of the screen do the exact same thing with every window except one, the "review workout window." On all other windows the left button is a back/exit and the right a forward/toggle. For some reason the review workout screen, they do nothing. The touchscreen is also variable. For example, on the "review workout" touchscreen, the "no" option cannot be selected. Other users agree with my observations, but in over a year no one can explain why they are like this.
It has several other weird inconsistencies. If I use the "live track" option when recording a workout, the device won't sync to the app on my phone afterwards. If I am lucky, I can sync just by turning off live track and restarting both the device and my phone. If I am not lucky, I have to unpair the watch, restore it to factory settings, turn it off, clear app cache and data on the phone, uninstall the app, restart the phone, and then reinstall and pair the two devices all over again. Pairing the watch to my phone used to be a complicated dance that often took hours on hours of attempts until it would finally, randomly, connect. Luckily, I haven't had this issue for several months now. I imagine these annoyances might just as much be due to my phone as the device.
Still, the Garmin software itself seems bizarre. The Garmin Connect app for the desktop needs to be updated almost daily. Frequent updates are par for the course these days with phone apps, but not so much with desktop apps. It's annoying to have an update for Garmin every time I try to use my computer at home. The mobile app is the most fun to use out of the whole Garmin experience, although it's strange to me why Garmin Connect online is inconsistent with the mobile app. Take a look at the 2 calendars below. They are both for the time period, but I can see all sorts of daily data on mobile. Is there any reason Garmin opted to not have all this juicy, colorful data viewable from a desktop browser? I'll never know.


My biggest gripes with the watch are it's functional inconsistencies. One day it stops syncing, the next day it unpairs. I used to have to go to the watch, Garmin Connect Online, Garmin Connect Mobile, and Garmin Express all at the same time to disable my "move bar". Then, the second I have to reset any settings, which is frequently because all of the software is so buggy, the move bar enables again. And don't even get me started with this move bar!
“The red bar on the epix, fenix 3, Forerunner 920XT, vivoactive, vivofit, and vivofit 2 is referred to as the Move Bar. The bar will be displayed after one hour of inactivity. This bar builds in length the longer you are inactive. The first red bar equals one hour of inactivity. Each additional bar equals 15 minutes of inactivity.”
There is all this data out there indicating that just moving a little bit, but frequently and throughout the day, is healthier than being highly active for long periods of time paired with long periods of inactivity. So, I get the intent of the move bar. Apparently, people need to be reminded to get up and move around. Me, I have the opposite problem. There are often times when I need to concentrate, or at a minimum, focus on one thing for a even a short period of time. That's great if I can move around while doing so. Our culture is a sitting one though, and I really struggle staying put. This makes the move bar all the more annoying. First off, the move bar doesn't adjust to any other activity you do. I could have just ridden 100 miles on my bike, which takes me several hours. I could be home, taking a shower, getting dressed and eating some food (things the move bar timer doesn't sense). The move bar can vibrate before I even get a rest. However, the move bar is most frustrating when it vibrates when I am sitting and have little choice about it. The move bar goes off when I am in the dentist chair, at the theatre, sitting in traffic, stuck in a meeting, on an airplane with the seatbelt light on, and all the other times when taking walk would be quite welcome, but quite inconvenient. I hate the reminder. It's not for me. I don't need it and I don't care about walking or "steps" or whatever the trend is these days. I wish it were less of a hassle for me to clear. It's bad enough there there is no watch face that doesn't include the red move bar line into it's design. I just don't care.
One true problem is the hardware's temperature sensitivity. The unit is rated to work in conditions to -4, but mine can't handle temps below 10 or 15 degrees. The screen freezes and the devices stops tracking. Once the device continued to track with the screen froze, but I lost all my data the 5 other times I skied in cold weather this year, even though I had the device tucked in a pocket where I hoped it would stay warm.
Now, you might be wondering why I gave it a 3 bike rating with all these complaints. It's a buggy, annoying piece of technology, sure, but it's also pretty fun. I have always been fascinated with tracking my own activity. Garmin does this well. Garmin tracks what I want to track better than any other competitor I've seen. Nearly every wearable tracker these days is step-based. Since my activities are cycling, skiing, and gym-based, step counters counter my activity. Garmin tracks what I want; distance, elevation, speed, weather, heart rate, maps and more. The newer software interface is colorful, fun to look at, and motivating.
Take a look at some of the images below. It is really gratifying to see data like "you've logged more cycling activities than 99% of other users (all ages, male and female). Who knows how many commuters use Garmins, but it feels like a nice pat on the back regardless. I also get to see a super low resting heart rate, and it helps me to feel healthy and strong. I enjoy how the new interface gives you a snapshot of the day or the week. I enjoy the graphs of various attributes over time. The Pebble is a better piece of hardware, but I never had so much juicy sports data as I do now.


The Vivoactive has a great battery life for my level of use. It lasts almost a week for my typical activities, a couple of days when I am riding for hours on end. Not only that, it charges very quickly. It charges fully in about an hour. If I wake up in the morning and notice I let the battery die, I can charge a couple of day's worth in the few minutes it takes me to get dressed. Syncing with My Fitness Pal, Strava, and MapMyRide has been flawless. I get awesome videos from Relive, too. Relive pulls data from Strava, which uses data from Garmin.
And I trust my data. I can't say if the "calories burned" data is at all accurate, but it is consistent and predictable at this point. I burn about 300 calories commuting to work in one direction. I burn anywhere from 350 to 550 calories taking a boxing class, and the burn is consistent with my perceived effort. The heart rate tracking seems true. The wrist monitor is consistent, and tracks continuously. It also tracks a low heart rate, something my old monitors couldn't do. My older Polar, Suunto, and Sigma tended to lose connection when my heart rate dropped below 60. What it can't do is manage sudden surges in heart rate. When I am biking to work, I can see the wrist monitor under report when I suddenly put out a big effort. Compared to commutes when wearing the watch with a chest strap, the wrist monitor seems to lose accuracy above 130. When my heart is pounding at 160bpm or above, it may report a 40 or 50 reading. At least the inaccuracies are easy to spot. I don't mind this, as it's know that wrist monitors do a better job tracking the heart rate at rest anyway.
I went on a couple of ski trips with other people who had other Garmin GPS devices. While the devices never agreed, they were consistently close within a couple hundred feet, both in distance and elevation. One device would tend to rate the elevation higher than me, so while neither were probably perfectly correct, they all seemed consistent.
This watch has been a hassle, but the activity tracking is fantastic. It works as a bike computer, too. I just strap it on the handlebars like it's a bike and pedal on. Overall, I am glad I made the purchase, but I am going to do a lot of research before I'd buy one again.
Geeking out on statistics
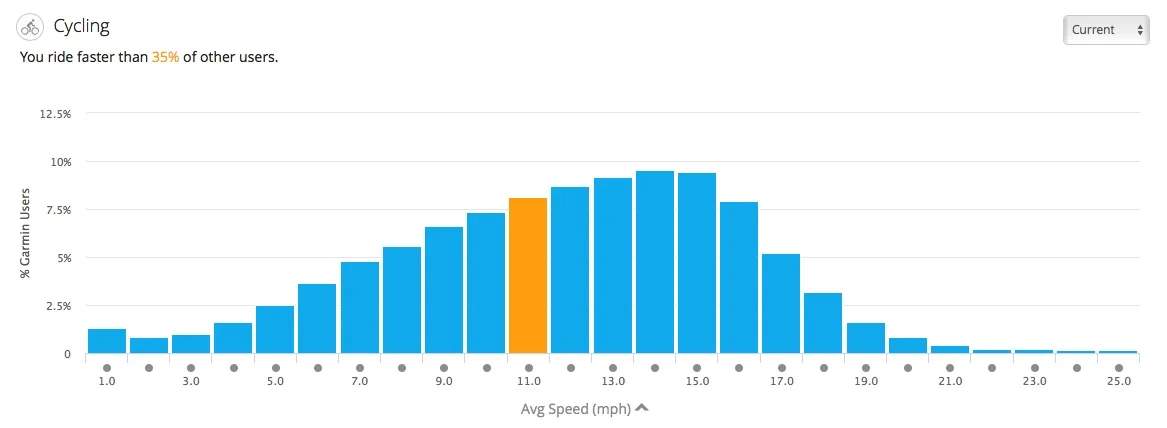
I eagerly reviewed my Garmin Connect Insights to compare my own tracking from other Garmin users like me. In all honesty, I felt a wave of disappointment when I saw the default cycling graph (above). This graph tabulates all Garmin connect users' recorded cycling data in my 4-year age range. Interestingly enough, looking at just women or just men didn't change my standing more than a couple of percent points. I mean, biking is my thing, man, how can I be below the curve?!

But then I noticed there are other stats to look at! When it comes to distance- I am above the curve! I ride farther than 80% of users! Oh yeah! Now I can gloat properly!
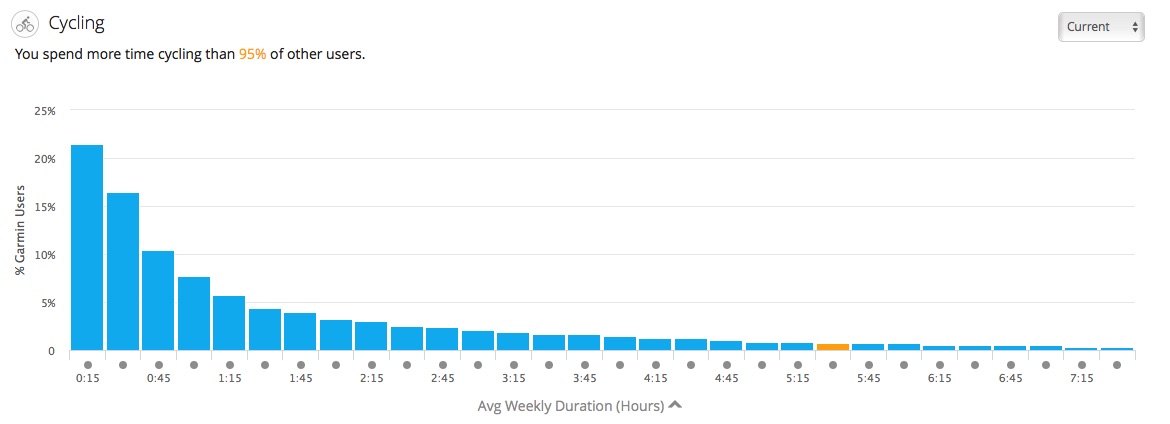
Next I checked out time, and lo and behold, I spend more time riding than 95% of other Garmin users in my age range! Now I can really gloat! Big gloaty smiles all around!
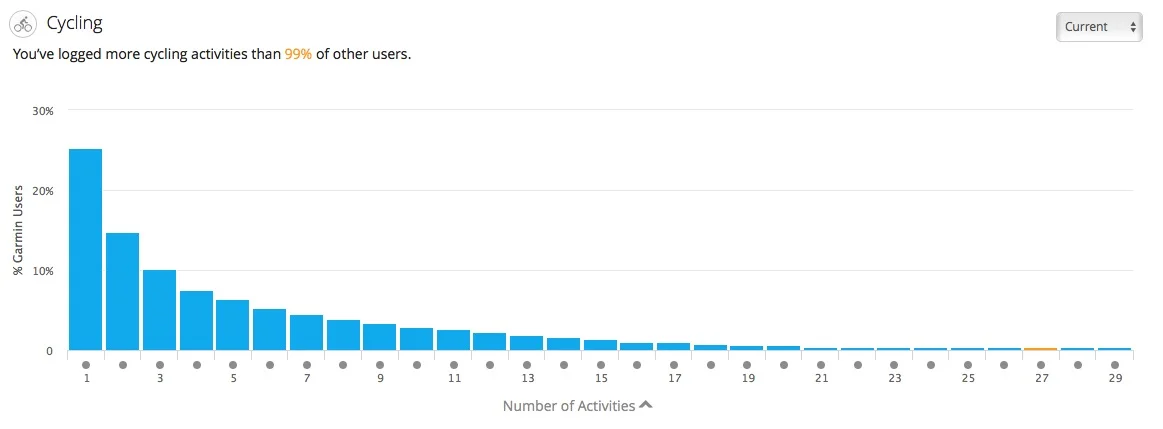
Last I looked at activities, which is the number of times I logged a cycling event, and here's where it really got crazy. I ride more cycling events than 99% of other Garmin users! That's the kind of percentile I can be truely proud of. This sort of data reflects the kind of riding I do, though. Most of my riding is commutes to work. That's 2-3 separate rides a day. They are slow paced and take a long time. There are not a lot of other riders, commuters or not, who deal with riding in the winter. Either the weather is prohibitive (hello east coast and most of the west coast considering this year's storms) or it's too dark, or simply not fun. I am lucky to live in a place where rain and dark is my only obstacle.
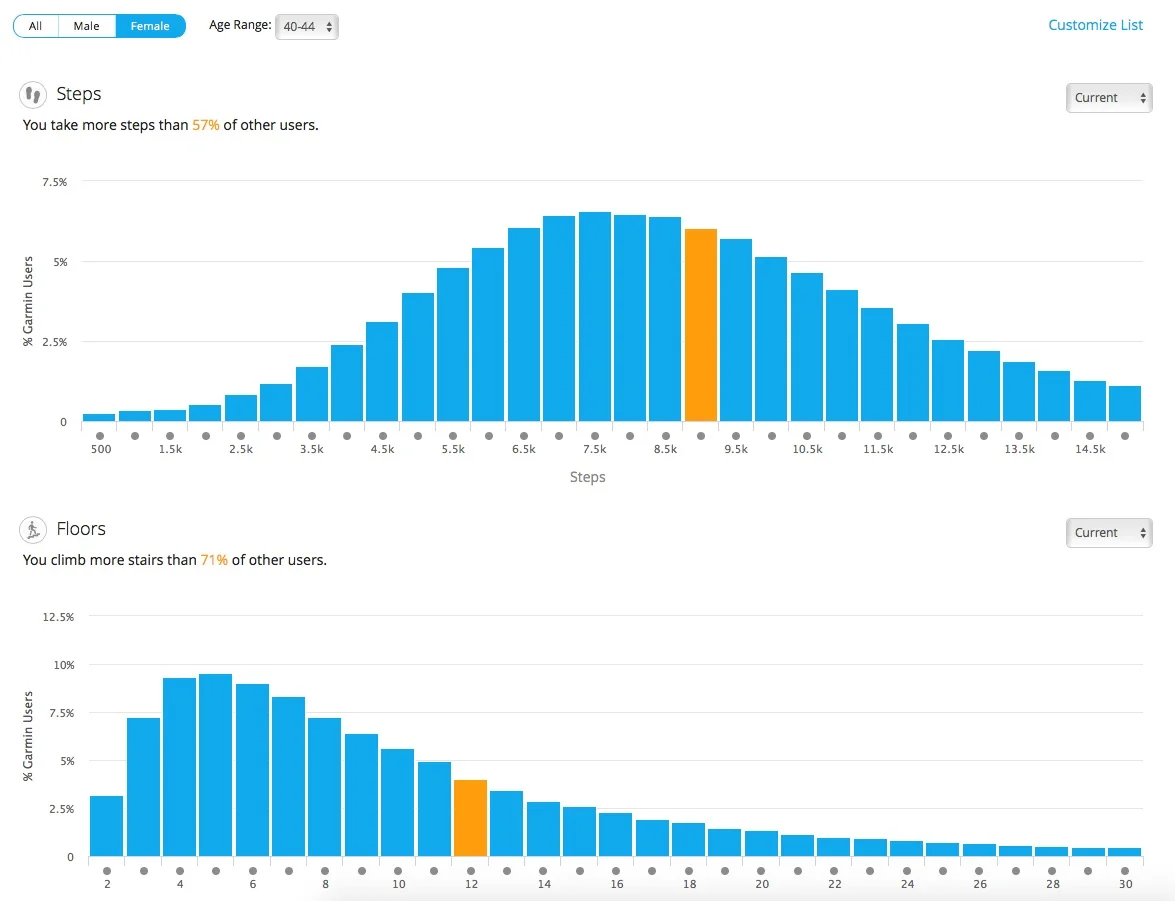
The following charts surprised me. Cycling is my thing. I also do yoga, I do Zumba, I lift weights. And that's all I care about when it comes to physical activity. I have the move bar turned off and my steps and floor goals set so low I meet them every day. I don't care about walking or how many floors I climb. I enjoy hiking, but I haven't done much of that lately. I know for a lot of people, walking and taking the stairs is their thing, so I was surprised to see I rated so high in that category.