

The Garmin Fenix series watches make a calculated estimate of VO2 max based on recorded physiological data over time. People tell me it’s pretty accurate. I remain skeptical, but only because it thinks I’m better than I think I am. Still, a VO2max of 48, or even anywhere in the 40s for that matter is as about as good as a non-competitive woman in her 40’s can get. I’m going to bask in the feeling of achievement this analysis that Garmin gave me.
Bragging a Little Bit
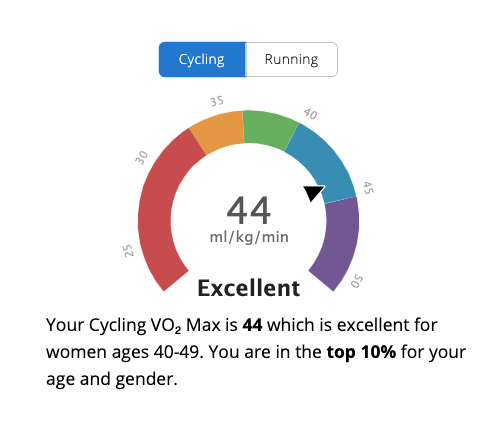
My Garmin told me my VO2 Max is in the top 10% for my age and gender. Take that heart disease! No one can blame me for my ailments, no one! My will is stronger than my body.
Personalized Heart Rate Zones Matter
Garmin’s Default Zones

Personalized Zones
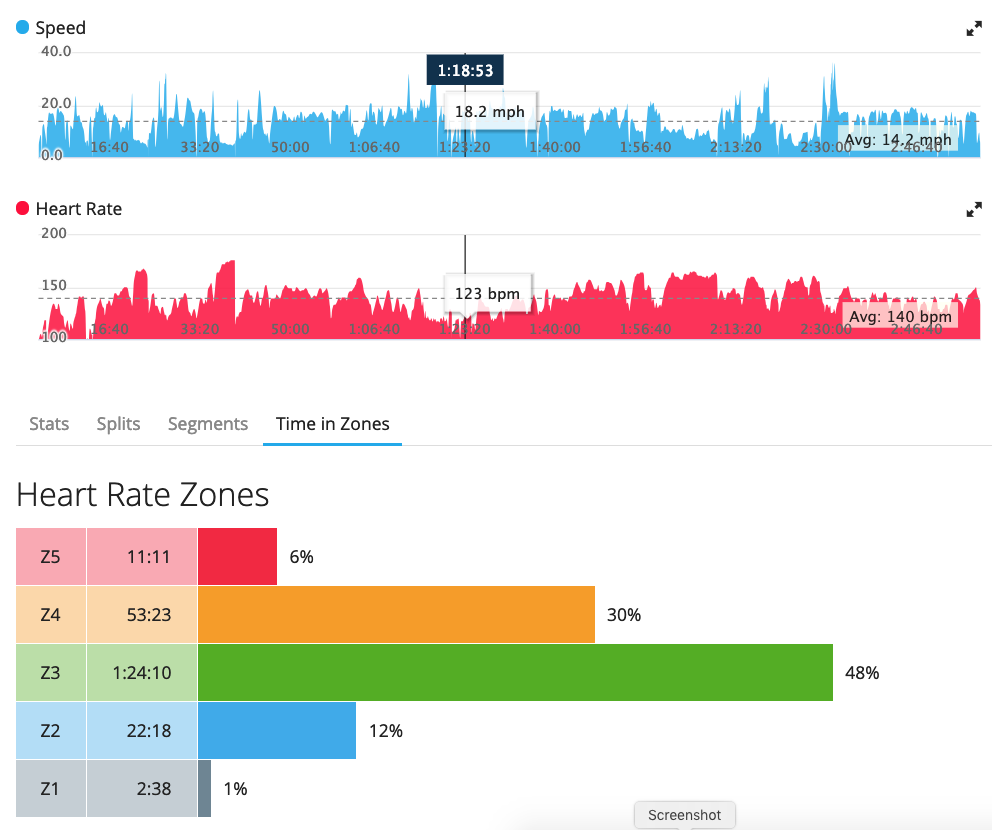
I recently had a performance test (VO2 Max and maximal heart rate). The physiologists assigned personalized heart rate zones using the results of this test. I decided to compare my new zones with my “old” zones. My old zones were assigned by Garmin Connect. Garmin uses a lot of information to create your zones, but can only estimate VO2 Max based on other data. The charts above represent 2 bikes rides. Both rides were with the same riding group, in similar areas north of Seattle. Both rides were very similar in distance, elevation, time and effort. Really only things different are the times spent in each heart rate zone. Even the average heart rates are practically identical! Garmin has me spending a little time in zone 2 and 5 and nearly the whole ride in zones 3 and 4. My personalized zones have me spending most of my time in zone 2. I also spent 30 minutes in zone 1 and no time in zones 4 and 5.
What does this mean and why do I care? Zone training is a bit of a dying art in cycling these days, falling behind power training. I am a recreational rider, I don’t compete, I have nothing to gain from training beyond good cardiovascular fitness, so I see no reason for me to shell out hundreds of dollars for a power meter. Even so, I am motivated to perform at my best, so gazing at my heart rate from time to time makes sense to me. The first thing I was told when I got my zones was that the most useful thing for me to do was to avoid zone 3 (the green zone) better known as “no man’s land”. While this aerobic level is a great place to build strong endurance, apparently you build it faster by spending more time in zone 2, then pushing up to zones 4 and 5. My head sunk when I heard this “green zone” training is the most common mistake made by casual cyclists, as I knew I spent the overwhelming majority of my time in the green zone. It also seemed curious to me how much time I spent in the upper zones. I’d spend some rides almost entirely in the top 2 zones. That didn’t seem healthy. However, by adjusting zones for my real calculated VO2 max, you see that I actually spend most of my time in zone 2, like I should. However, I spent a bit of time in zone 1, which is no zone at all. Zone 1 in this case is sitting heart rate. My lab used a 4-zone method and Garmin uses 5, so my personalized zone 1 is nothing and zone 2 has a wide range encompassing both warm-up and low intensity activity. Since my tracker times out when I am stopped, I spent too much time riding my bike not working out at all. I also spent a bit of time in zone 3, but I think that’s OK for this type of ride. It was a group ride, and our goal was to ride at the same pace, so nothing really called for the higher zone use.
I think it’s pretty interesting how different the graphs look. The “accurate” graph far better reflects my perceived exertion, for what it’s worth.
Heart Rate Zone Training Chart
I found this chart from a web search. I don’t like the “lose weight” category. From what I understand, the assumption of using zones to lose weight has been disproven. Even though it is easier and more sustainable for most people to do activity at low intensities (like walking), burning 100 calories walking or doing box jumps is the same 100 calories to your body’s caloric needs at the end of the day. That being said, I liked this chart the best out of the many out there.
My Own Best Self

I recently took a fitness test that measured my VO2 Max, ventilatory values and lactate threshold. I went to a physiology lab at a college to take the test. Each test is sport specific, so I mimicked cross-country skiing when I did mine. I stood on a wide, sticky treadmill with ski poles. The physiologists strapped a large mask over my nose and mouth to measure my breathing and oxygen consumption. It covered so much of my face that it helped me feel more on my own, diminishing the extreme anxiety I felt being in a “test” environment. On the flip side it was hard to breathe and felt a little claustrophobic. They strapped a heart rate monitor to my chest. I wear my own monitor every day, so that was no big deal. In fact, the polar chest strap felt so comfortable that I forgot it was there. My own Wahoo strap has to be unpleasantly tight to stay on and I look forward to removing it the second I finish working out. As I started walking on the treadmill, they incrementally increased its elevation and speed. They pricked my finger every 3 minutes to measure the lactic acid in my blood. They had to keep increasing it more than they anticipated because my fitness was higher than they or I predicted.
It turns out my VO2 max is literally “off the chart” at 45.5 ml/kg/min. The chart above doesn’t have a top end, it just lists over 36.9 as superior for my age group. The chart the lab uses lists 39 to 42 as superior for my age group. Even though cardiovascular capacity decreases with age, I am still superior for any age! perused the internet a bit to learn more about these numbers, and immediately noted that every chart is a little bit different. Still, I rate as “superior” for all of them. Many sources cited that heavier weight decreases the calculation. I ate a gigantic resort omelet just before the test. Not sure if that was to blame, but I weighed in 9 pounds heavier than I do at home. Could it be that my “real” weight is less, making my “real” VO2 max even higher than the result? I also read that VO2 max decreases at altitude. Since I took the test at a significantly higher altitude than home, could it be that my “home” VO2 max is even higher still? This came to me as a massive confidence boost. Every stumble, every insult, every insignificance I felt onward from this test couldn’t dampen my spirit. Now I can simply say to myself, “well, sure I’m really bad at (fill in the blank), but I have a super high Vo2 max! For real!” This is cold, hard data, no one can disprove it.
This test also reminded me that you do improve whatever it is you put your heart into. Sure, cardiovascular health is really important to me. I started blood pressure medication as a teenager and nearly every relative I have survived a heart attack, died from a heart attack, or both. A deep drive to take out any smidge of “personal responsibility” out of any poor health conviction or disease I may have is a strong desire for me to eat and exercise responsibly. That that is just what got me going. The truth is I LOVE riding my bike. I LOVE skiing. I LOVE my boxing classes. It comes natural to spend many hours a week doing these activities. I put a lot of energy in my 20’s worrying about weight and image. My daily energy in the past decade has been more one of love, exploration, and accomplishment. I didn’t think about scoring my relative fitness once, I just did what I love and strived to be my best self. When I was younger, I LOVED drawing. I drew all the time. I probably spent as much time drawing in a day as I exercise now in a week. I got pretty good at it. I don’t draw much any more, so I am reminded that while interests change, it still matters to do what you love.
I need to acknowledge how much my life situation contributes to my fitness. I demand jobs with easy commutes. I never lasted long in any job with a drive. I had the luxury to choose jobs that meet this quirky requirement that I seem to be alone in demanding. I am incredibly lucky that I found a job and a home with an easy commute that I can do almost every day. I have a stable job that pays enough to supply me with quality gear that keeps me comfortable when I’m riding. I have a relaxed enough job that I am not too tired to exercise outside of work. I have a relaxed enough boss that it’s ok for me to start about 10 minutes later than my official start time to allow time to get dressed after my gym class ends (I make up for the lost time at the end of the day). I spent a few years going through different gyms. I just lucked out with this one. A work friend mentioned she went there, and it just hit me that I should try it too (this is a pun because it’s a boxing gym). The gym really took my fitness to the next level. I’ve always had strong thighs, ever since I played soccer in high school. I had strong arms and lats before from lifting weights. Biking gave me cut calves. But I never, ever had a strong core. The boxing gym, Title Boxing Club, gave me visible obliques and shoulder muscles.

I spent a lot of time feeling like I’m at my best, at my peak, this year. It’s a wonderful feeling. Every day, every moment, I am thankful for the gifts that help me feel this way; health, good fortune, and not having the setbacks of injury or collusion when out on the road.
Deeper Dive Into Heart Rate Training

Heart Rate Zones Determined by Central Oregon Community College Physiology Lab

Heart Rate Zones Calculated by Lactate Threshold

Heart Rate Zones Determined by Heart Rate Reserve & Resting Heart Rate

Heart Rate Zone Default Supplied by Garmin Connect
There are several different ways to calculate target heart rate zones. The easiest is to subtract your age from 220 and use that number as your maximum heart rate. From there, you can calculate each target zone based on the percentages established for each method. This method is a good start as our maximum heart rate decreases with age. It is determined by genetics and cannot be changed. However, if your genes vary from typical, these measurements will be incorrect. The worst thing about this method is it doesn’t account for fitness.
I recently took VO2 Maximal test at an academic Physiology Lab. The test incrementally pushed me harder and harder on a treadmill until my maximum heart rate was recorded. That last minute was pretty hard, I had to push through my body telling me to slow down for almost 2 minutes. Once my heart rate reached 180, I had to keep it there long enough to confirm it wouldn’t go any higher. The test dispelled a common myth about heart rate, one that I believed up until that moment. For some reason, I assumed “maximum” heart rate meant that my body couldn’t handle heart rates beyond it, and would die. I thought of my heart like a car, that would shake, rattle, and eventually crash if it went at speeds beyond what it could handle. Turns out that’s not true at all. All “maximum heart rate” means is that your heart will not beat any faster. That’s it. That’s the maximum. At that point, other processes take control and work to slow us down. Our bodies do a superb job of keeping us intact, better than any piece of mechanics or electronics I’ve used. My blood lactate levels and ventilatory were also tested.
I spent some time looking at my maximum heart rate (which is perfectly typical, by the way) to try to understand what makes my personalized zones so personal. Note that the college uses a “4 zone” system and Garmin uses 5. The images above are from Garmin, so I had to add a “zone zero” in the zone 1 place, which is fine because zone 1 is essentially a warm-up zone for Garmin, too. My calculated fat-burning zone is 121-141. This is the zone trainers suggest endurance athletes spend most of their time training in. Garmin’s default would have me at 108-126. I would essentially make no basic endurance gains if I used Garmin’s calculations. This is a shocking difference. My resting heart rate gets closest with 130-142.
Resting heart rate calculation is spot on for the low end of the endurance zone (zone 3) at 142. But the calculation using my lactate threshold got the top end closest at 157 versus 164. Still, Garmin’s default is way worse at 126-144. The lactate threshold zone (zone 4) has some differences based on definition. Nearly all zone methods I’ve seen top this zone out at your lactate threshold. However, the college tops it out at a few beats above your lactate threshold. My lactate threshold is high for my cohort, meaning I am an endurance athlete. A sprinter would have a very different lactate threshold. Interestingly, this is estimated pretty well from my resting heart rate at 167. Even the default method, using only my age and gender for source data, got pretty close at 162. I guess the “default” person is better adapted for endurance than sprints. All charts show my max heart rate at 180 as max heart rate is static and I have no genetic anomalies changing that.
The big take home lesson here is that heart-rate-based training appears to be useless without more data beyond your age. I am very glad I took this test, even though I’m not “training” for anything in particular.